![[ e-networld.de ]](/img/logo.png)
PiMonitor
A monitoring dashboard for the Raspberry Pi as a single binary: CPU, temperature, memory, network, alert webhooks and a REST API. No database required.
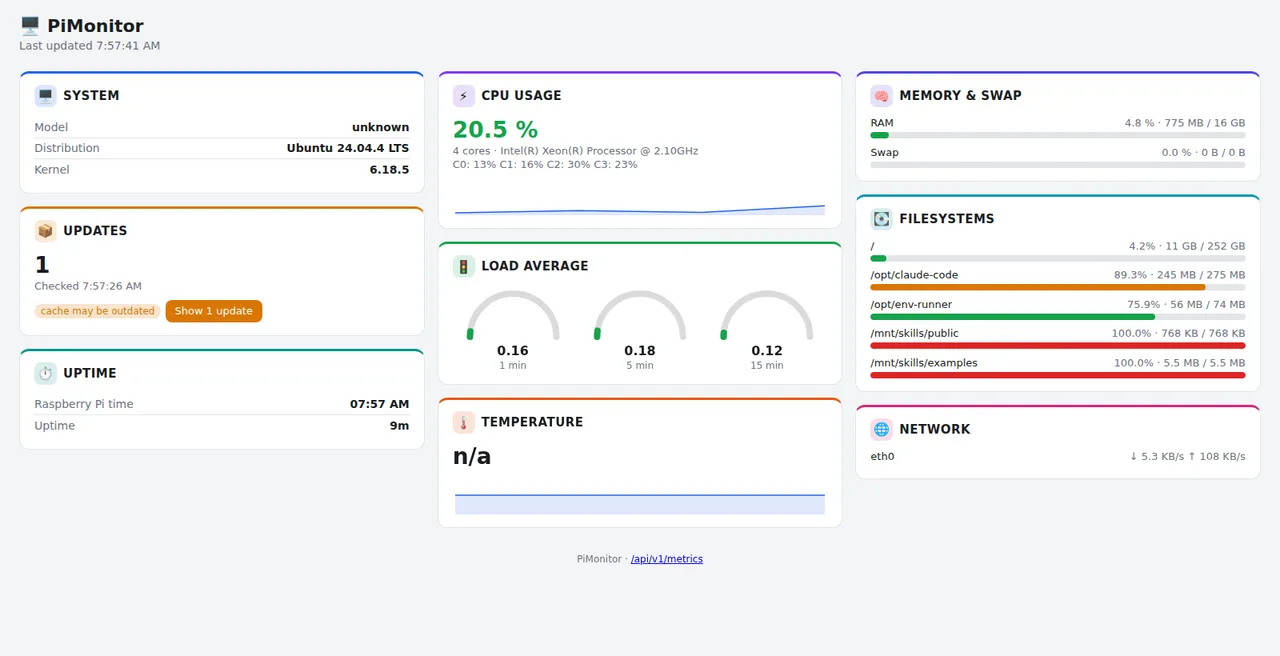
Overview
PiMonitor shows at a glance how a Raspberry Pi is doing: load, temperature, memory, filesystems, network and pending package updates. It is meant for anyone running one or several Pis at home who does not want to set up a full monitoring stack for them.
Technically PiMonitor is a single binary running as a systemd service. It reads values from /proc, /sys and the apt cache, keeps a short history in memory and periodically writes it to a compact file so it survives restarts and reboots. No database is involved, and the web dashboard is embedded in the binary.
The main service never needs root: it only reads world-readable files. A separate, privileged systemd timer refreshes the apt cache. Because the configuration file can hold an API key, it is readable only by root and the pimonitor group.
The versioned REST API under /api/v1/ allows single values to be polled individually, for example temperature only, which is all an openHAB or Home Assistant integration needs. An optional Prometheus endpoint exposes the current snapshot in text format, so PiMonitor can be scraped into Prometheus and Grafana without an extra exporter. Threshold alerts trigger webhooks whose delivery is decoupled from the collection path, so a slow receiver never delays sampling.
Features
Installation
curl -fsSLO https://raw.githubusercontent.com/LarsLaskowski/PiMonitor/main/packaging/download-latest.sh
chmod +x download-latest.sh
./download-latest.sh
cd pimonitor_*_linux_*
sudo ./install.shThe script detects the architecture itself (arm64 or armv6) and downloads the matching release. The dashboard is then available at http://<pi>:8080/.
Releases
v0.8.0 · 03/09/2026
- Surface alert status in the dashboard UI
- Add configurable, collapsible dashboard card layout
- Add CodeQL suppression comments for security trade-offs
- Address follow-ups from #152 layout review
- Redraw sparklines immediately when a card is revealed via the layout modal
- Fix broken openHAB Thing example in docs/API.md
v0.7.0 · 30/08/2026
- Harden download-latest.sh against curl (23) write errors
- Report unhealthy on GET /healthz when the latest snapshot is stale
- Add optional built-in HTTPS/TLS
- Add access_log_enabled toggle and GET /api/v1/serverstats
- Add Prometheus /metrics exposition endpoint
- Formalize code review process with pimonitor-reviewer subagent
- Derive route registration, bucketing and counters from one table
- Add per-metric REST sub-resources under /api/v1/metrics
v0.6.0 · 27/08/2026
- Add govulncheck CI job, Dependabot, and raise Go toolchain to 1.26.7
- ci: bump actions/checkout from 4.3.1 to 7.0.1
- ci: bump golangci/golangci-lint-action from 7.0.1 to 9.3.0
- ci: bump actions/setup-go from 5.6.0 to 7.0.0
- ci: bump goreleaser/goreleaser-action from 6.4.0 to 7.2.3
- Make internal/collector compile on macOS and Windows
- Unify threshold JSON/YAML types to remove the four-way duplication
- Pause dashboard polling while the tab is hidden, guard in-flight polls
- Serve history deltas via ?since= instead of the whole window
- docs: fix README claim that history is not persisted across restarts
- docs: fix three drifted claims in ARCHITECTURE.md
- @dependabot[bot] made their first contribution in https://github.com/LarsLaskowski/PiMonitor/pull/135
v0.5.1 · 23/08/2026
- Share a single vcgencmd runner between temperature and throttled collectors
- Add cache validators to embedded static assets
- Make load-average gauges use CPU thresholds, not fixed 70/100%
- Mark gopkg.in/yaml.v3 as a direct dependency in go.mod
- Pin apt child process locale in UpdatesCollector
- Move history persistence's fsync off the collector's tick goroutine
- Stop leaking PIMONITOR_API_KEY into vcgencmd's environment
- Bound concurrent /api/v1/... requests and cache the history response
- Add release download script
- Mark /api/v1/... responses no-store and fix Vary clobbering
- Derive static asset ETags from content instead of the build version
- Add a json template helper for webhook bodies
v0.5.0 · 21/08/2026
- docs: add migration guide from RPi-Monitor to PiMonitor
- Cap history capacity to prevent OOM from misconfigured window/interval
- Add SonarQube/SonarCloud integration to CI
- Fix new high-severity SonarCloud issues
- Fix remaining SonarCloud MEDIUM/LOW severity issues
- Stamp webhook rate limiter only on successful delivery
- Evict stale per-device history series in the collector
- Add PIMONITOR_API_KEY env var and warn about -api-key exposure
- Isolate webhook delivery per destination and skip futile retries
- Fix dashboard showing "n/a" for a legitimate 0.0 °C reading
- Warn and skip the notifier worker when alerts are disabled
- Ensure Snapshot.Disks marshals as [] instead of null