![[ e-networld.de ]](/img/logo.png)
PiMonitor
Monitoring-Dashboard für den Raspberry Pi als einzelne Programmdatei: CPU, Temperatur, Speicher, Netzwerk, Alerts per Webhook und eine REST-API. Ohne Datenbank.
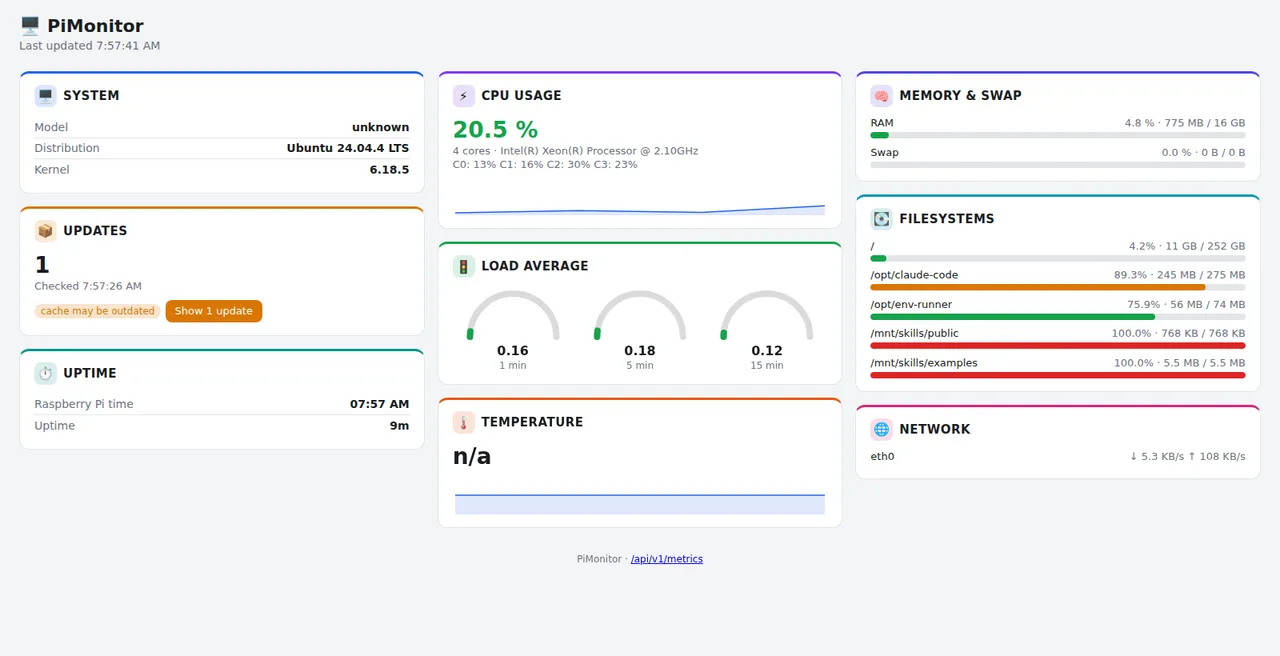
Überblick
PiMonitor zeigt auf einen Blick, wie es einem Raspberry Pi geht: Auslastung, Temperatur, Speicher, Dateisysteme, Netzwerk und anstehende Paket-Updates. Es richtet sich an alle, die einen oder mehrere Pis im Heimnetz betreiben und dafür keinen vollständigen Monitoring-Stack aufsetzen möchten.
Technisch ist PiMonitor eine einzelne Programmdatei, die als systemd-Dienst läuft. Es liest die Werte aus /proc, /sys und dem apt-Cache, hält einen kurzen Verlauf im Speicher und schreibt ihn regelmäßig in eine kompakte Datei, damit er Neustarts übersteht. Eine Datenbank wird nicht benötigt, das Web-Dashboard ist in die Programmdatei eingebettet.
Der Hauptdienst braucht keine Root-Rechte: er liest ausschließlich öffentlich lesbare Dateien. Nur ein separater systemd-Timer aktualisiert den apt-Cache mit erhöhten Rechten. Die Konfigurationsdatei kann einen API-Key enthalten und ist deshalb nur für Root und die Gruppe pimonitor lesbar.
Über die versionierte REST-API unter /api/v1/ lassen sich einzelne Werte gezielt abfragen, etwa nur die Temperatur, was für Integrationen in openHAB oder Home Assistant genügt. Ein optionaler Prometheus-Endpunkt liefert den aktuellen Stand im Textformat, sodass PiMonitor ohne zusätzlichen Exporter in Prometheus und Grafana eingebunden werden kann. Schwellwert-Alerts lösen Webhooks aus, deren Zustellung vom Messpfad getrennt läuft: ein langsamer Empfänger bremst die Messung nicht.
Funktionen
Installation
curl -fsSLO https://raw.githubusercontent.com/LarsLaskowski/PiMonitor/main/packaging/download-latest.sh
chmod +x download-latest.sh
./download-latest.sh
cd pimonitor_*_linux_*
sudo ./install.shDas Skript erkennt die Architektur selbst (arm64 oder armv6) und lädt das passende Release. Danach ist das Dashboard unter http://<pi>:8080/ erreichbar.
Releases
v0.8.0 · 03.09.2026
- Surface alert status in the dashboard UI
- Add configurable, collapsible dashboard card layout
- Add CodeQL suppression comments for security trade-offs
- Address follow-ups from #152 layout review
- Redraw sparklines immediately when a card is revealed via the layout modal
- Fix broken openHAB Thing example in docs/API.md
v0.7.0 · 30.08.2026
- Harden download-latest.sh against curl (23) write errors
- Report unhealthy on GET /healthz when the latest snapshot is stale
- Add optional built-in HTTPS/TLS
- Add access_log_enabled toggle and GET /api/v1/serverstats
- Add Prometheus /metrics exposition endpoint
- Formalize code review process with pimonitor-reviewer subagent
- Derive route registration, bucketing and counters from one table
- Add per-metric REST sub-resources under /api/v1/metrics
v0.6.0 · 27.08.2026
- Add govulncheck CI job, Dependabot, and raise Go toolchain to 1.26.7
- ci: bump actions/checkout from 4.3.1 to 7.0.1
- ci: bump golangci/golangci-lint-action from 7.0.1 to 9.3.0
- ci: bump actions/setup-go from 5.6.0 to 7.0.0
- ci: bump goreleaser/goreleaser-action from 6.4.0 to 7.2.3
- Make internal/collector compile on macOS and Windows
- Unify threshold JSON/YAML types to remove the four-way duplication
- Pause dashboard polling while the tab is hidden, guard in-flight polls
- Serve history deltas via ?since= instead of the whole window
- docs: fix README claim that history is not persisted across restarts
- docs: fix three drifted claims in ARCHITECTURE.md
- @dependabot[bot] made their first contribution in https://github.com/LarsLaskowski/PiMonitor/pull/135
v0.5.1 · 23.08.2026
- Share a single vcgencmd runner between temperature and throttled collectors
- Add cache validators to embedded static assets
- Make load-average gauges use CPU thresholds, not fixed 70/100%
- Mark gopkg.in/yaml.v3 as a direct dependency in go.mod
- Pin apt child process locale in UpdatesCollector
- Move history persistence's fsync off the collector's tick goroutine
- Stop leaking PIMONITOR_API_KEY into vcgencmd's environment
- Bound concurrent /api/v1/... requests and cache the history response
- Add release download script
- Mark /api/v1/... responses no-store and fix Vary clobbering
- Derive static asset ETags from content instead of the build version
- Add a json template helper for webhook bodies
v0.5.0 · 21.08.2026
- docs: add migration guide from RPi-Monitor to PiMonitor
- Cap history capacity to prevent OOM from misconfigured window/interval
- Add SonarQube/SonarCloud integration to CI
- Fix new high-severity SonarCloud issues
- Fix remaining SonarCloud MEDIUM/LOW severity issues
- Stamp webhook rate limiter only on successful delivery
- Evict stale per-device history series in the collector
- Add PIMONITOR_API_KEY env var and warn about -api-key exposure
- Isolate webhook delivery per destination and skip futile retries
- Fix dashboard showing "n/a" for a legitimate 0.0 °C reading
- Warn and skip the notifier worker when alerts are disabled
- Ensure Snapshot.Disks marshals as [] instead of null